
-
-
Spectrum/signal Analyzers
View AllUNIT spectrum analyzer has the characteristics of high performance, faster and more reliable. More scan points can find more hidden abnormal signals. The large, touchable screen enhances the user experience. The detachable dustproof and compact structural design make the machine more beautiful and easier to maintain. More ports, supporting common protocols, provide convenience for automation and remote control. It can meet most radio frequency related applications and needs.
Promotion :
Get all Option free once you purchase Spectrum Analyzer UTS1000B/T or UTS3000B/T From our Store*

Spectrum/signal Analyzers
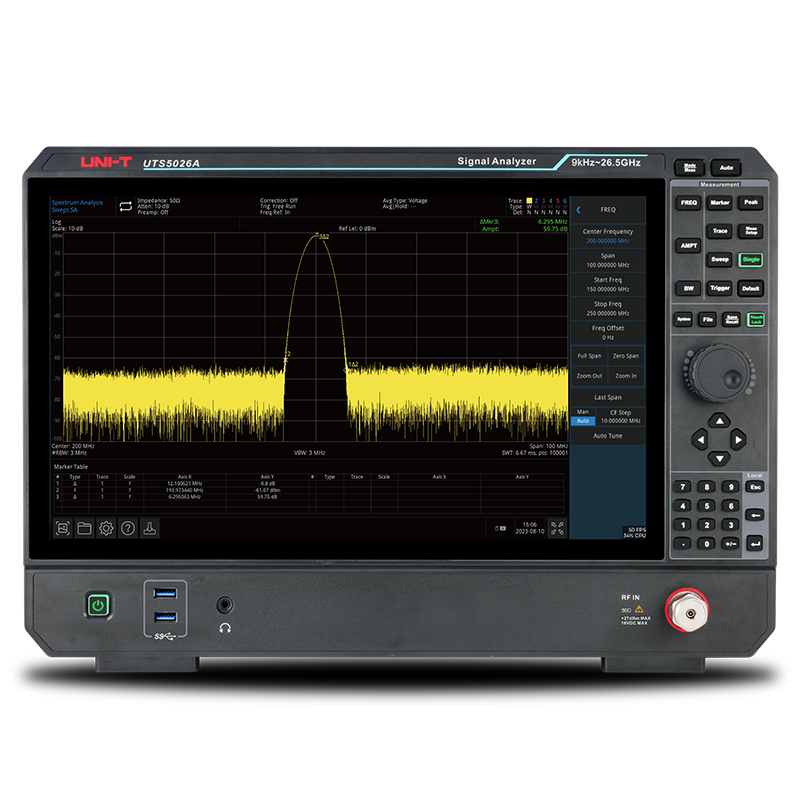
| Model | Frequency Range | RBW | Trace | Scan Points | Trace Source |
|---|---|---|---|---|---|
| UTS5026A | 9kHz~26.5GHz | 1Hz~3MHz (10% step), 4, 5, 6, 8MHz | 6 Trace | 100,001 scan points | 25 MHz/ 40 MHz(option) |
| Model | Frequency Range | RBW | Trace | Sweep Points | Trace Source |
|---|---|---|---|---|---|
| UTS3036A | 9kHz~3.6GHz | 1Hz~10MHz | 6 Trace |
Scan 40001 points | Yes |
| UTS3060A | 9kHz~6.0GHz | 1Hz~10MHz | 6 Trace | Scan 40001 points | Yes |
| UTS3084A | 9kHz~8.4GHz | 1Hz~10MHz | 6 Trace | Scan 40001 points | Yes |
| UTS3084A | UTS3060A | UTS3036A | ||
|---|---|---|---|---|
| Spectrum Analyzer | ● | ● | ● | |
| Real-time spectrum Analyzer | ● | ● | ● | |
| Vector network Analyzer | ● | ● | ● | |
| Tracking generator | ● | ● | ● | |
| I/Q Analyzer | ○ | ○ | ○ | |
| EMI | ○ | ○ | ○ | |
| Analog demodulation | ○ | ○ | ○ | |
| Vector signal Analyzer | ○ | ○ | ○ | |
| Advanced measurement | ○ | ○ | ○ | |
| ●: Standard ○: Optional ×: Not support | ||||
| Model | Frequency Range | RBW | Trace | Sweep Points | Trace Source |
|---|---|---|---|---|---|
| UTS3084T+ | 9kHz~8.4GHz | 1Hz~3MHz | 6 Trace | Scan 40001 points | Yes |
| UTS3036T+ | 9kHz~3.6GHz | 1Hz~3MHz | 6 Trace | Scan 40001 points | Yes |
| UTS3032T+ | 9kHz~3.2GHz | 1Hz~3MHz | 6 Trace | Scan 10001 points | Yes |
| UTS3015T+ | 9kHz~1.5GHz | 1Hz~3MHz | 6 Trace | Scan 10001 points | Yes |
| UTS3084T+ | UTS3036T+ | UTS3032T+ | UTS3015T+ | |
|---|---|---|---|---|
| Spectrum Analysis | ● | ● | ● | ● |
| EMI | ○ | ○ | ○ | ○ |
| Analog Demodulation | ○ | ○ | ○ | ○ |
| Advance Measurement | ○ | ○ | ○ | ○ |
| Tracking Generator | ● | ● | ● | ● |
| ●: Standard ○: Optional ×: Not support | ||||
| Model | Frequency Range | RBW | Trace | Sweep Points | Trace Source |
|---|---|---|---|---|---|
| UTS3084T | 9kHz~8.4GHz | 1Hz~3MHz | 6 Trace | Scan 40001 points | Yes |
| UTS3084B | 9kHz~8.4GHz | 1Hz~3MHz | 6 Trace | Scan 40001 points | No |
| UTS3036B | 9kHz~3.6GHz | 1Hz~3MHz | 6 Trace | Scan 40001 points | Option |
| UTS3021B | 9kHz~2.1GHz | 1Hz~3MHz | 6 Trace | Scan 40001 points | Option |
| UTS3021B | UTS3036B | UTS3084B | UTS3084T | |
|---|---|---|---|---|
| Spectrum Analysis | ● | ● | ● | ● |
| EMI | ○ | ○ | ○ | ○ |
| Analog Demodulation | ○ | ○ | ○ | ○ |
| Advance Measurement | ○ | ○ | ○ | ○ |
| Tracking Generator | ○ | ○ | × | ○ |
| ●: Standard ○: Optional ×: Not support | ||||
| Model | Frequency Range | RBW | Trace | Sweep Points | Trace Source |
|---|---|---|---|---|---|
| UTS1032T | 9kHz~3.2GHz | 1Hz~1MHz | 4 Trace | Scan 10001 points | Yes |
| UTS1032B | 9kHz~3.2GHz | 1Hz~1MHz | 4 Trace | Scan 10001 points | No |
| UTS1015T | 9kHz~1.5GHz | 1Hz~1MHz | 4 Trace | Scan 10001 points | Yes |
| UTS1015B | 9kHz~1.5GHz | 1Hz~1MHz | 4 Trace | Scan 10001 points | No |
| UTS1032T | UTS1032B | UTS1015T | UTS1015B | |
|---|---|---|---|---|
| Spectrum Analysis | ● | ● | ● | ● |
| EMI | ○ | ○ | ○ | ○ |
| Analog Demodulation | ○ | ○ | ○ | ○ |
| Advance Measurement | ○ | ○ | ○ | ○ |
| Tracking Generator | ● | × | ● | × |
| ●: Standard ○: Optional ×: Not support | ||||
Choosing the Right Spectrum Analyzer: A Comprehensive Guide for Electrical Engineers
Introduction: In this guide, we'll help you make an informed decision when selecting a spectrum analyzer. As an electrical engineer, having the right tools is crucial for accurate measurements. Spectrum analyzers are essential instruments that provide valuable insights into signal frequency spectra. Discover how to choose the ideal spectrum analyzer for your needs, with a focus on Uni-T's offerings.
The Role of Frequency Range: Frequency Range is a key factor when choosing a spectrum analyzer. Different applications require specific ranges for precise signal analysis. It's important to match the top-end of the range with the applications the spectrum analyzer will be used for. Some common examples are:
RF Signal Characterization:
- 1.5GHz: Ideal for RF signals in RFID, AM or FM wireless communication, and LF, MF, HF, VHF, and UHF bands.
- 2.1GHz: Broad coverage for microwave links verification, EMI, and EMC applications.
- 3.2GHz: Beneficial for part of S-band, C-band signal analysis, such as satellite television, GPS, Bluetooth, television broadcasting, mobile communications such as GSM, CDMA, and LTE services
- 3.6GHz: Extends into the telecommunication, suitable for satellite ground stations and high-frequency radar.
- 8.4GHz: Versatile for C-band and below applications, such as telecommunication, WIFI6 and WIFI6E device test application.
Understanding Common Specifications: To make an informed decision, it's essential to understand common acronyms and specifications related to spectrum analyzer features:
-
DANL (Displayed Average Noise Level):
- The DANL is a measure used to define the sensitivity of a spectrum analyzer.
- It specifies all the internal noise of the spectrum analyzer referenced to 1 Hz and represented in dBm/Hz.
- The DANL is frequency-dependent, and it increases with frequency.
- Essentially, it sets the lower limit for the instrument’s ability to measure signals. Any input signal below this level cannot be accurately detected by the analyzer.
-
RBW (Resolution Bandwidth):
- RBW is the smallest frequency span that the analyzer can resolve.
- It determines the frequency resolution of the measurement.
- Smaller RBW values allow for more precise measurements but result in slower sweep times.
- Most spectrum analyzers use heterodyne-based techniques to sweep across a frequency span, and the trace showing power versus frequency is drawn from left to right.
-
Noise Floor:
- Thenoise floor represents the sum of all noise sources and unwanted signals within a measurement system.
- It includes thermal noise, black body noise, cosmic noise, atmospheric noise, and other unwanted man-made signals.
- The noise floor sets the smallest measurement that can be taken with certainty because any measured amplitude cannot be less than the noise floor.
- Lowering the noise floor can be achieved by cooling the system to reduce thermal noise or using digital signal processing techniques.
-
Selectivity:
- Selectivity refers to the ability of a spectrum analyzer to discriminate between different signals.
- It measures how well the analyzer can separate desired signals from unwanted interference or adjacent channels.
- High selectivity allows the analyzer to focus on specific signals of interest while rejecting others.
- Achieving good selectivity involves careful design of filters and other components in the analyzer.
-
Sensitivity:
- Sensitivity refers to the ability of the spectrum analyzer to detect weak signals.
- It is influenced by factors such as DANL, RBW, and overall system design.
- A more sensitive analyzer can detect smaller signals, making it useful for measuring low-level signals or identifying weak interference.
Additional Spectrum Analyzer Features and Functions: Consider these features for comprehensive analysis and ease of use:
- Frequency Range: Ensure the selected model covers your desired frequency range.
- Amplitude Accuracy: Vital for precise low-level signal measurements.
- Dynamic Range: Measures both weak and strong signals without distortion.
- Sweep Time: Capture transient signals with shorter sweep times.
- Display and User Interface: Intuitive displays and interfaces enhance efficiency.
- Connectivity Options: USB, Ethernet, and GPIB connectivity for seamless integration.
The Benefits of Tracking Generators: Discover the advantages of incorporating a tracking generator into your spectrum analyzer:
- Frequency Response Analysis: Enables precise frequency response measurements.
- Device Testing: Evaluate RF components' performance accurately.
- Calibration and Alignment: Facilitates calibration and alignment procedures.
- Antenna Analysis: Assess antenna properties, gain, impedance, and radiation patterns.
Conclusion: Choosing the right spectrum analyzer involves considering bandwidth and various features tailored to your application. Evaluate factors like frequency range, RBW, amplitude accuracy, dynamic range, sweep time, display quality, and connectivity options. With Uni-T's spectrum analyzers, you can confidently select the perfect tool to elevate your electrical engineering projects and ensure accurate results.